As a TOC, I had the advantage of meeting a variety of students from all different schools. However, with time constraints and limitations to my data collecting tool, I focused on questions that, when asked to students who barely knew me, would be comfortable in answering and was done quickly enough that it didn't impede in their class time. I wanted to know more about the thoughts of students on their own evaluation of their academic levels versus standardized testing results. I also wanted to know how much their ethnicity and economic status correlated to their studies based on how they felt treated in their school by their "authority" figures.
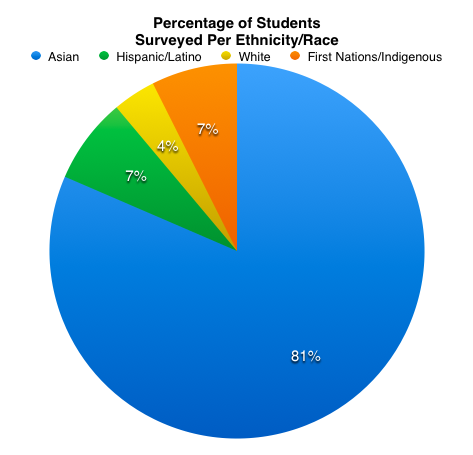
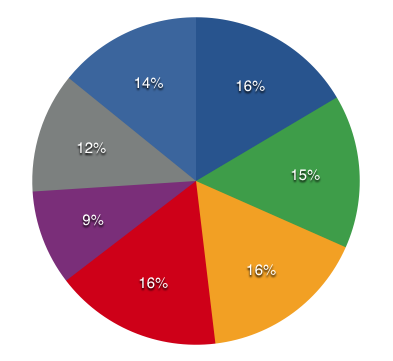
Essentially, I chose a day where the students' absent teacher left plenty of seat work time, which allowed me to pull one student up at a time to complete the survey online. I surveyed three classes, a total of 54 students who were taking Foods grades 10-12. I would also like to note that these students who participated were students that had decided to take this class as their elective and were a mixture of varying levels of academic success. The following pie chart shows the various ethnic groups I surveyed and how many in each group:
Essentially, I chose a day where the students' absent teacher left plenty of seat work time, which allowed me to pull one student up at a time to complete the survey online. I surveyed three classes, a total of 54 students who were taking Foods grades 10-12. I would also like to note that these students who participated were students that had decided to take this class as their elective and were a mixture of varying levels of academic success. The following pie chart shows the various ethnic groups I surveyed and how many in each group:
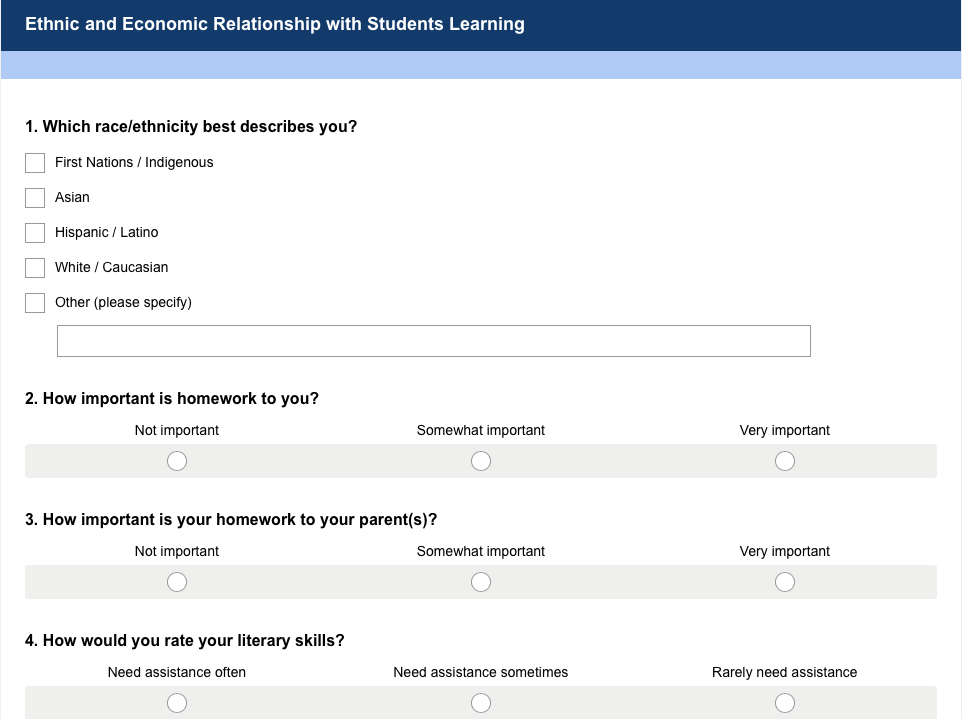
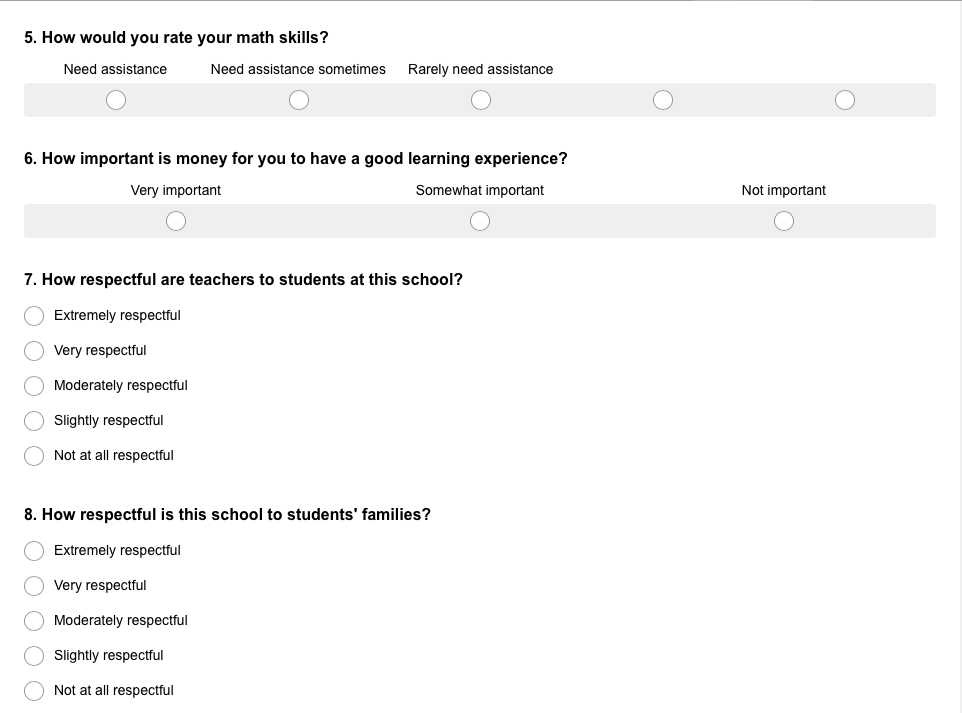
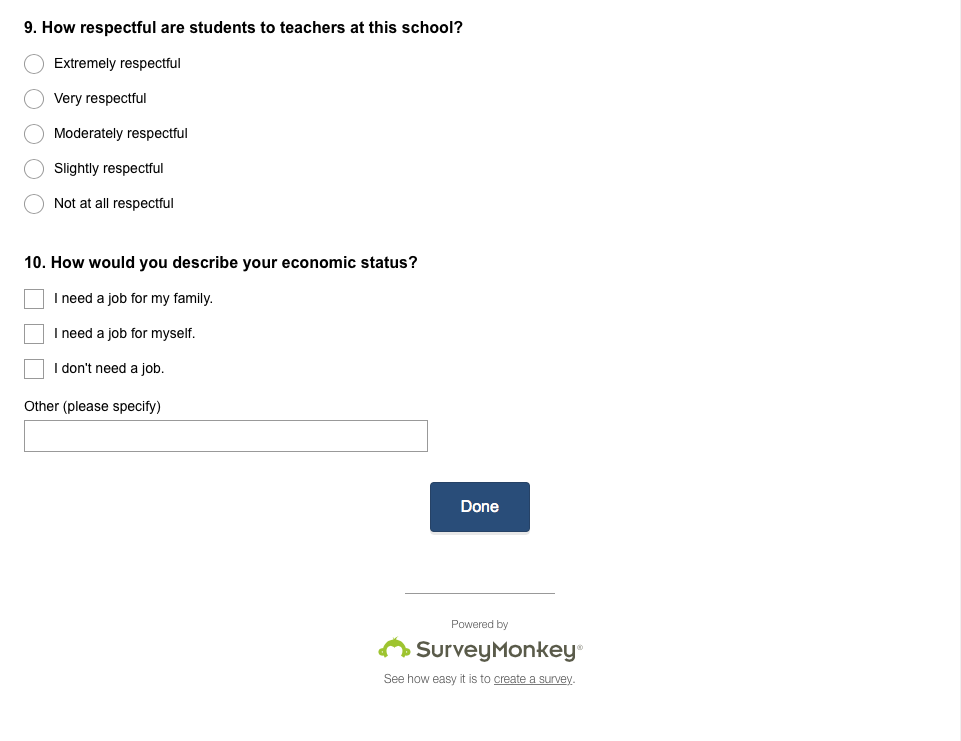
I created the survey on SurveyMonkey and it allowed a maximum of 10 questions. I never used this program before, although I've heard of it, and I soon discovered how to make the link active on an ongoing basis. Each time, I would open the link for the student (which I had posted on my Weebly website); I explained how to scroll down the page, how to select their answers and to click "Done" when they were finished. Here is an example of what they saw and the questions they were asked:
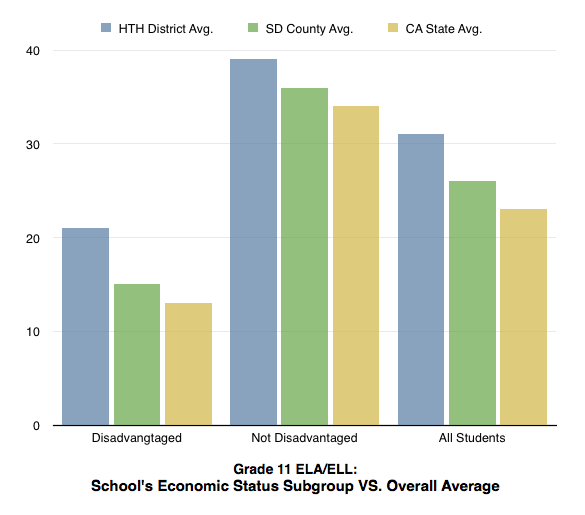
From here, I looked at the "Individual Responses" compiled in the SurveyMonkey account and generated graphs to make it easier to connect the responses with each ethnic group. I first looked at how Economic Status could be related to how the students rated their importance at this age to have a job, and how money could affect their learning experience:
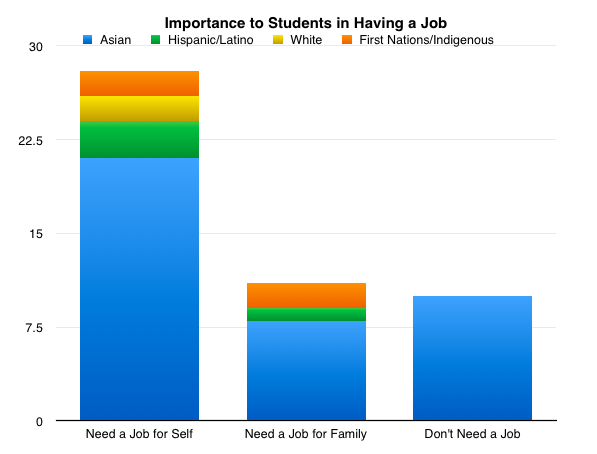 | 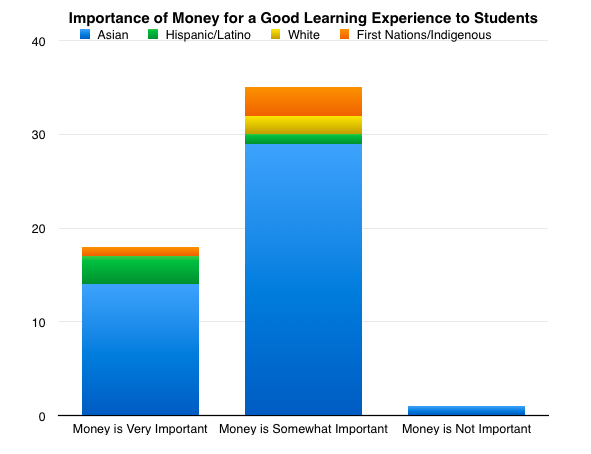 |
What can be identified in these results are that majority of these students, of all ethnicity, Asian, Hispanic/Latino, White, and First Nations/Indigenous, believe that they need a job for themselves. In other words, having a job to support themselves is important to them at the moment. In the opposite spectrum, there are no Hispanic/Latino, White, or First Nations/Indigenous students that "don't need a job." However, there are more Asians that don't need a job than Asians that need a job to support their family. We can further see that for all ethnic groups, money is "very" or "somewhat" important in providing a "good learning experience" to nearly all students surveyed. If we compare this to their perspective on their own literacy and math skills, we can see that students who value work and money value school as well.
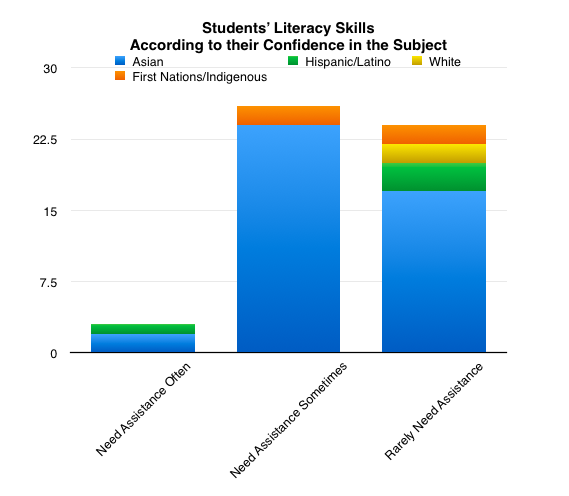 | 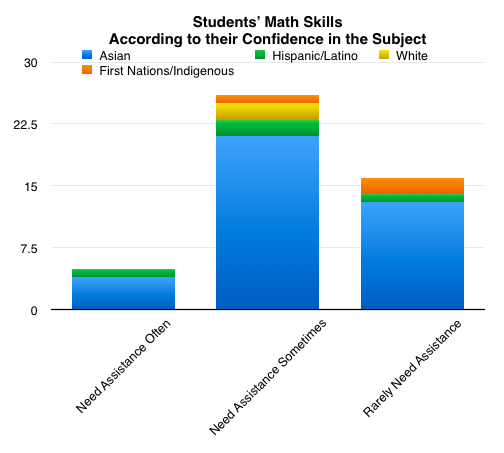 |
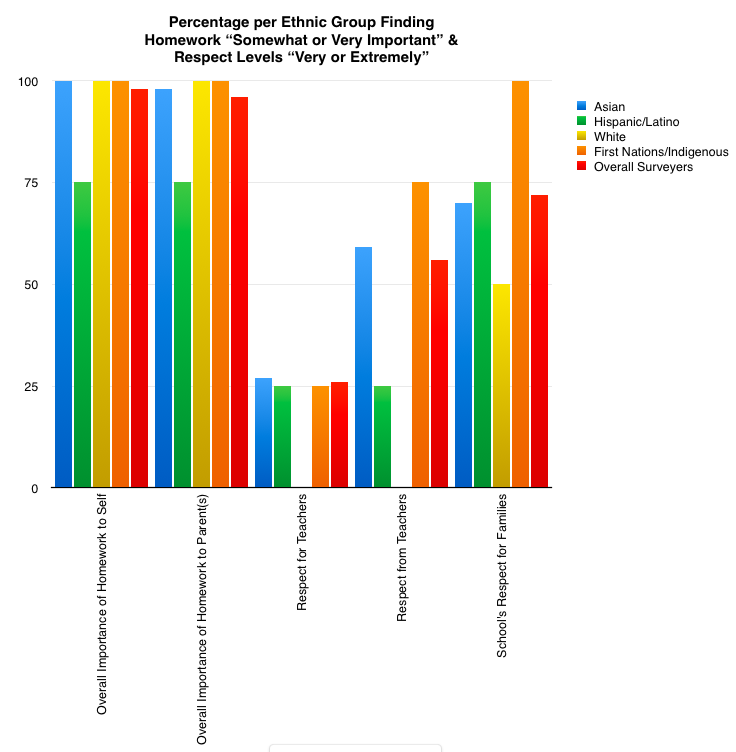
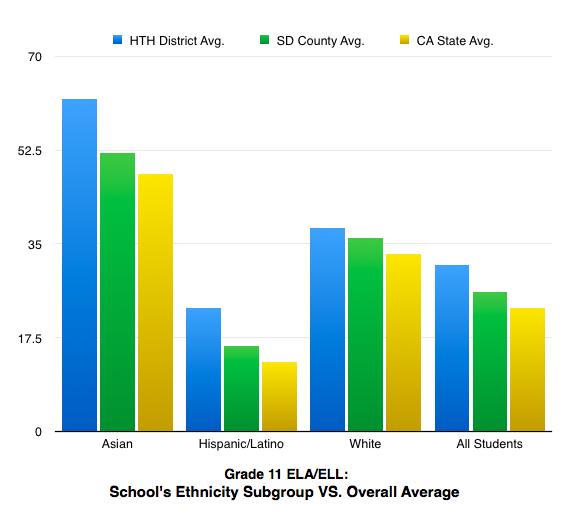
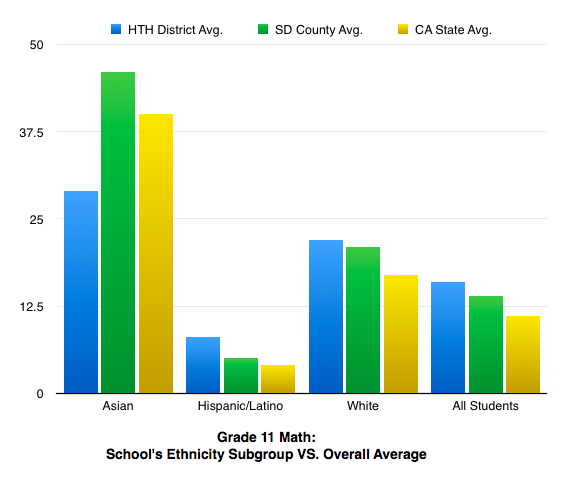
It is possible to believe from these results, the majority of these students, including all ethnic groups, "rarely need assistance" or only "sometimes need assistance" with their literacy and math. Therefore, their confidence in these subjects, with their ambition to work for themselves and have the money for a better education experience is all connected in these graphs. To further show how these students value school, the following graph indicates how nearly every student surveyed find homework "somewhat" or "very important" to themselves and to their parent(s). Although, it is important to note, the Hispanic/Latino group shows (similar data to my previous analysis article) as having the lowest percent in valuing their homework. In terms of "respect," there is a high percentage of students who feel "very" or "extremely" respected from their teachers and from the school to their families.
To conclude, students and their families who feel valued, appreciate the learning and teaching that takes place (even if students don't have a great deal of respect for their teachers in return), and are willing to work for money that will help them continue in their studies. Although the survey does not reveal the true nature of the students' economic status or their true level of academic success, we can see how students from this particular school, in this particular class, view their own general economic and academic status. Therefore, ethnicity does not play a major factor, especially in the diverse schools of Vancouver, B.C. and as teachers we need to learn more about what our students value, what their ambitions are, and respect them for their independence, individuality, and interests. Then, we will be able to better support our students' learning with the appropriate resources to do so.
 RSS Feed
